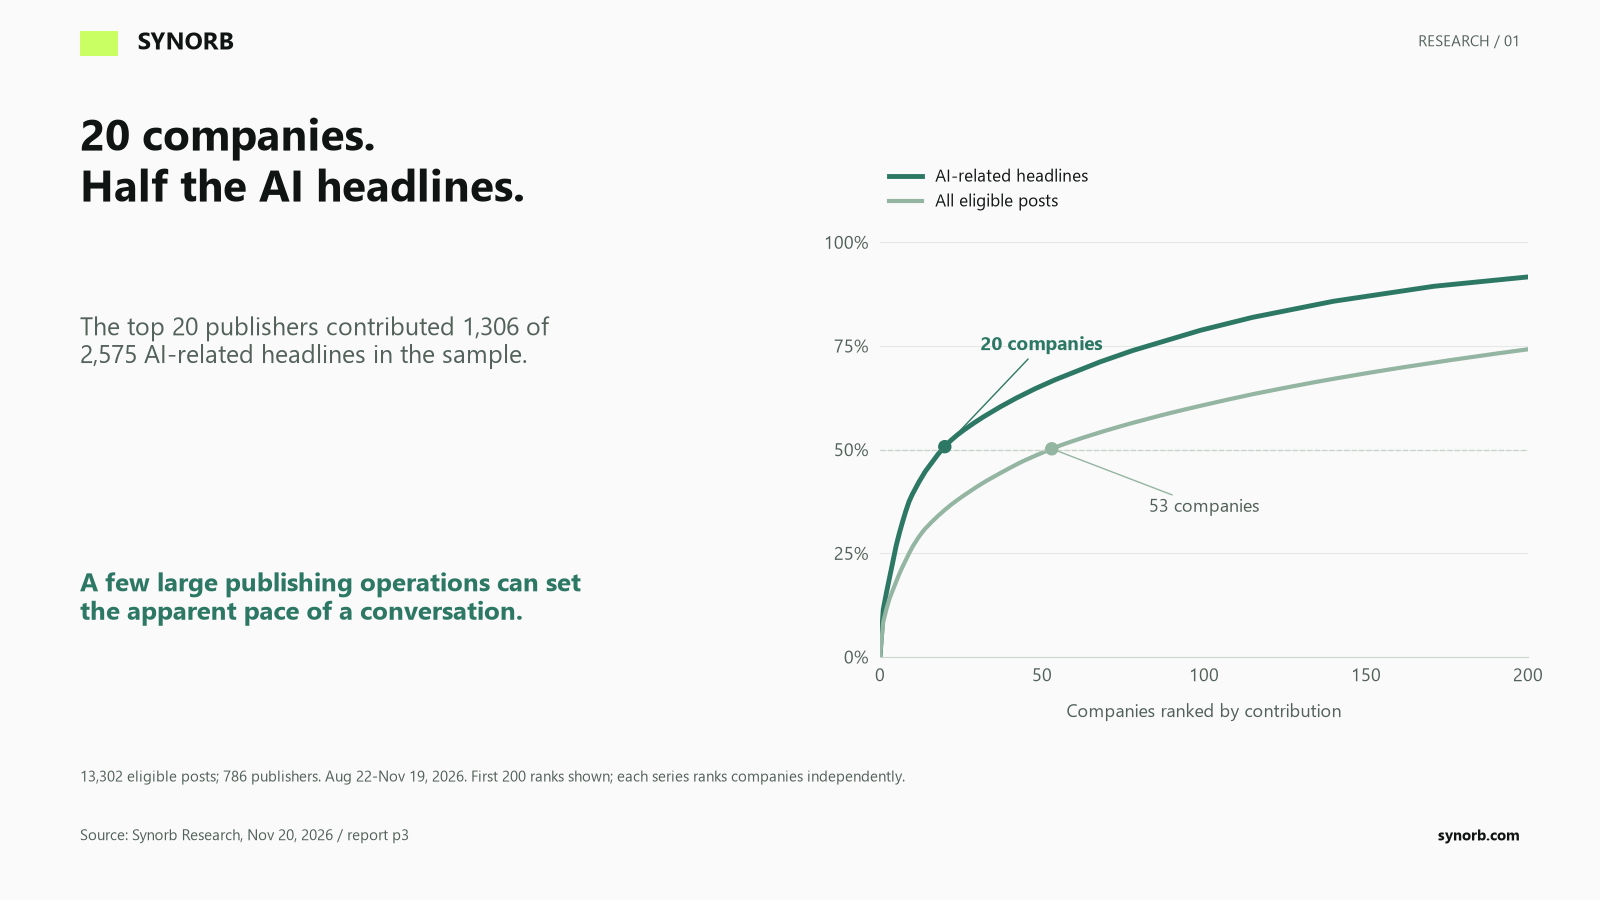
Twenty companies produced half of the AI-related headlines in our sample of public-company blogs and research.
That finding started with a broader question: which public companies publish in their own voice, and how can investors, analysts and reporters make use of what they say?
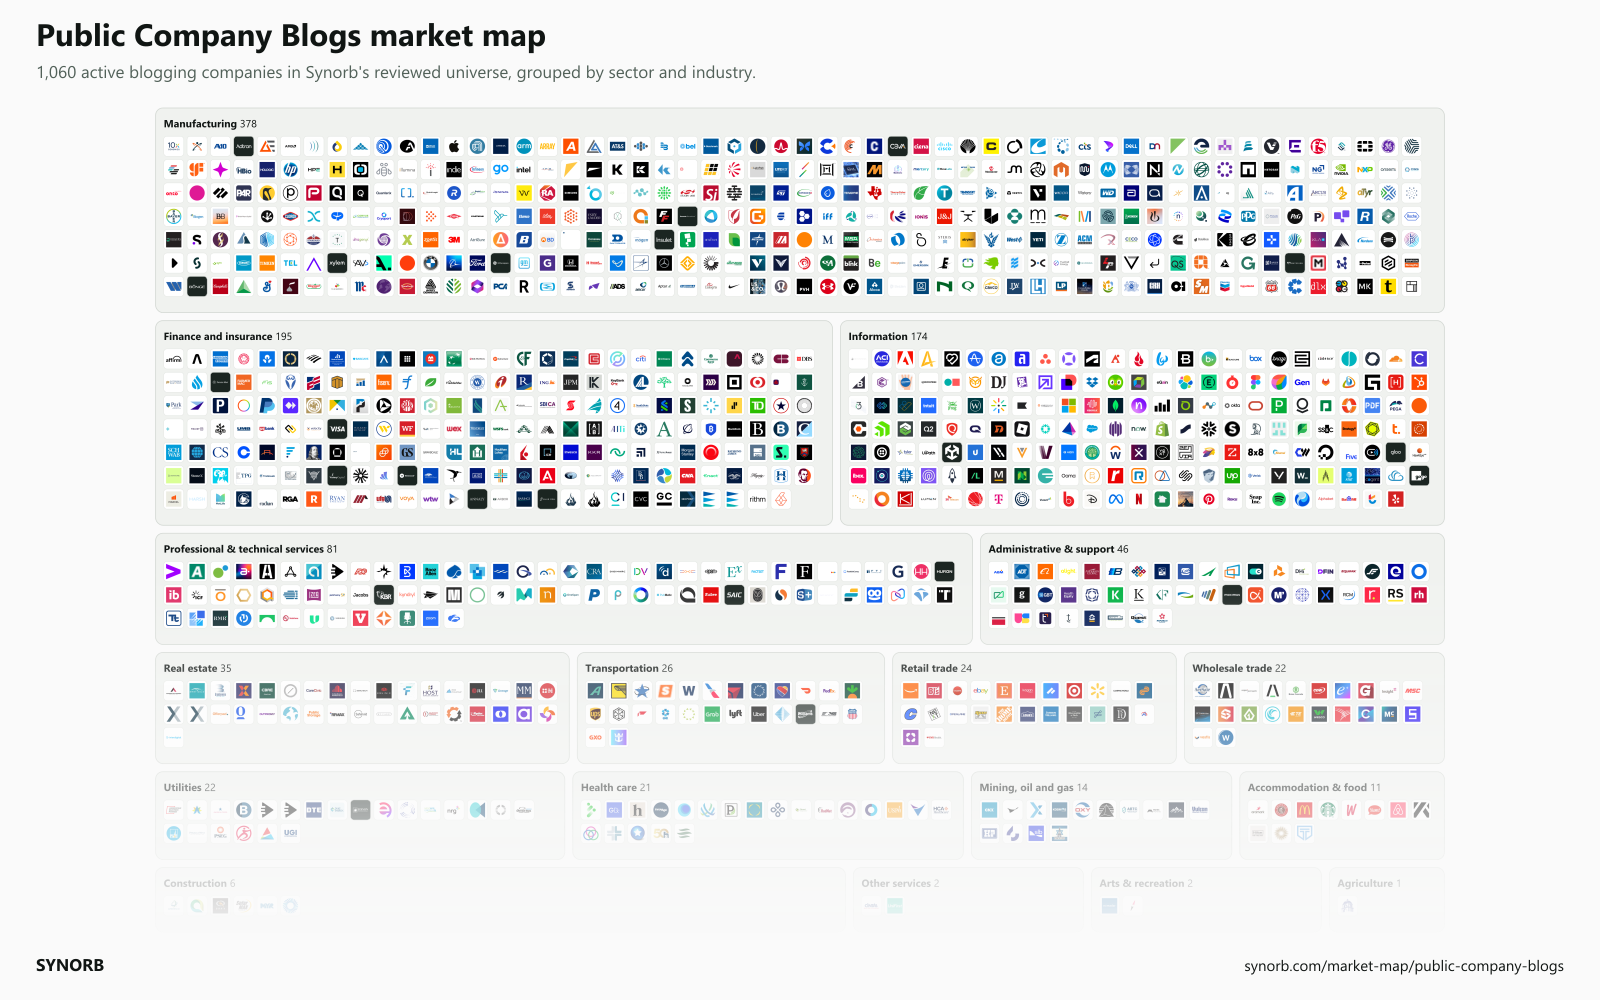
Today we are introducing the Public Company Blogs market map. It brings together 1,060 companies classified as active bloggers in our reviewed universe, organized by sector and industry. Use it to find a company's blog, explore its peers and open the corresponding Synorb company view.
Explore the Public Company Blogs market map →
A Primary Source Between The Filings
Product launches, engineering decisions, research, customer examples and changes in how a company describes its business often appear on its own publishing schedule. Those posts add detail between earnings calls and regulatory filings.
A dated company post gives you something specific to investigate: who said it, when they said it and where the original claim appeared. It also gives you the company's chosen account of events. Attribution and follow-up still matter.
Our reviewed census identified 1,060 active bloggers among 3,355 eligible companies, or 31.6%. That is roughly a third of our defined universe, rather than an estimate for every listed company worldwide. The map makes those sources easier to find and compare.
What Happens When You Read Across Companies?
We used Synorb with Claude to build a companion report, Who owns the corporate AI conversation? It examines 13,302 eligible collected posts from 786 publishers, published from August 22 through November 19, 2026. Those are the report's observed publishers; the wider map has a different population.
The report contains 30 chart-led analyses. Three findings show why access to the underlying sources matters.
Twenty companies produced half the AI-related headlines.
The largest 20 contributors supplied 1,306 of 2,575 AI-related headlines: 50.7%. It took 53 companies to pass half of all collected posts. A few prolific publishing operations can have a large effect on the conversation a reader sees.
For an analyst or reporter, that raises a useful question: is a theme spreading across more companies, or appearing more often from the same contributors?
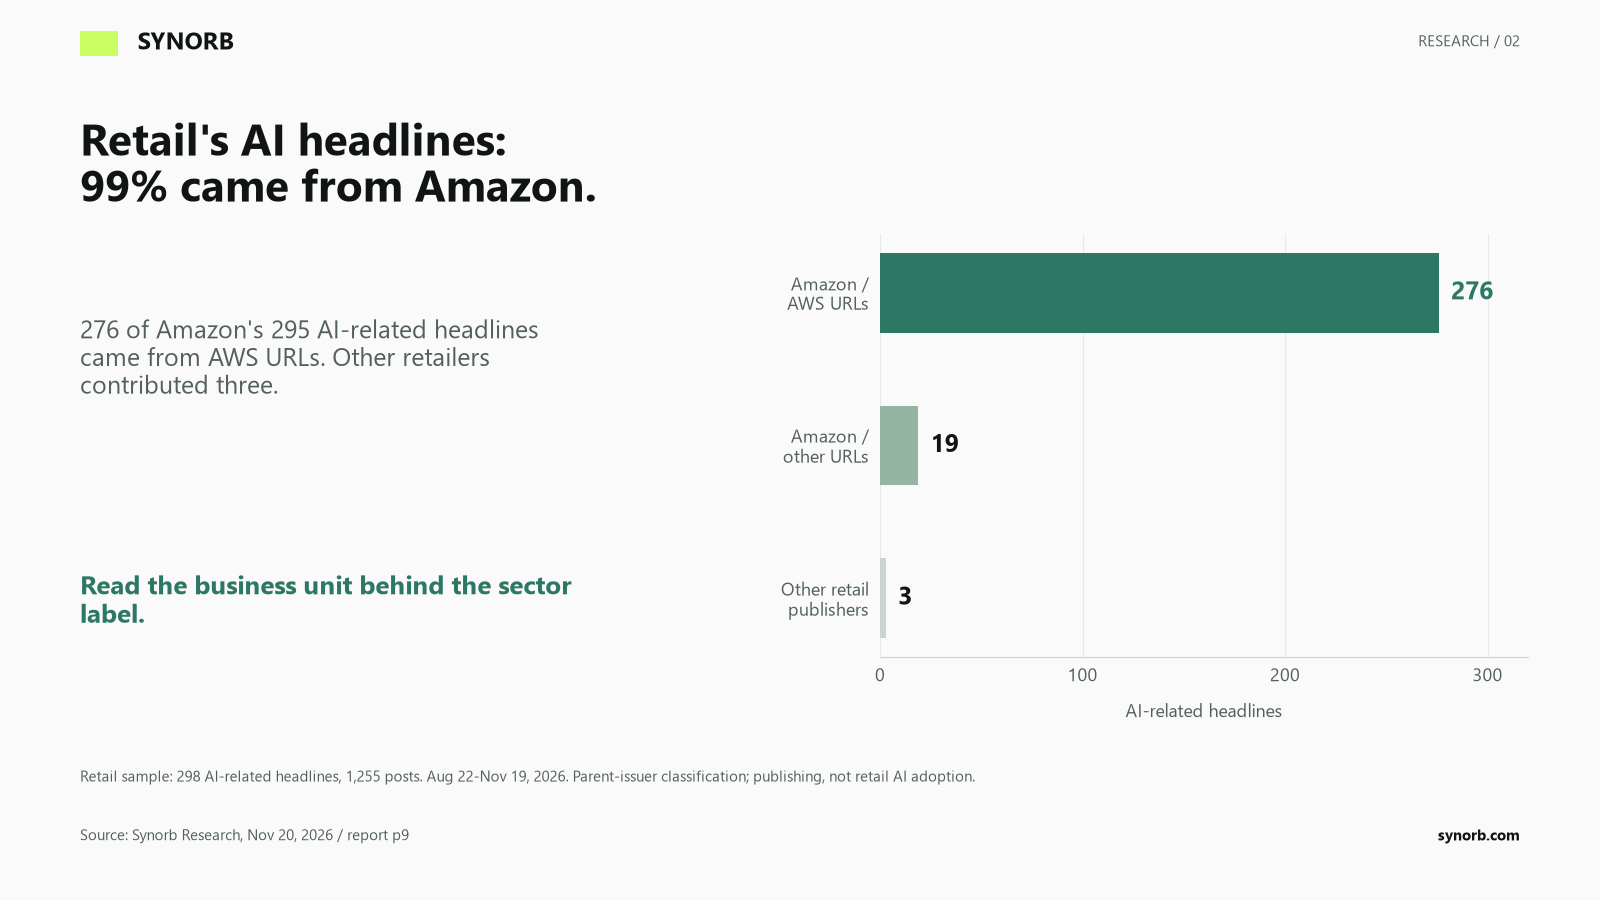
A sector label can hide the business behind the story.
Amazon supplied 295 of the 298 AI-related headlines classified under retail in the sample. Of Amazon's 295, 276 came from AWS URLs. The sector label follows the parent issuer, while much of that publishing concerns cloud computing.
That distinction matters when comparing sectors. The original posts help explain what is actually driving the result.
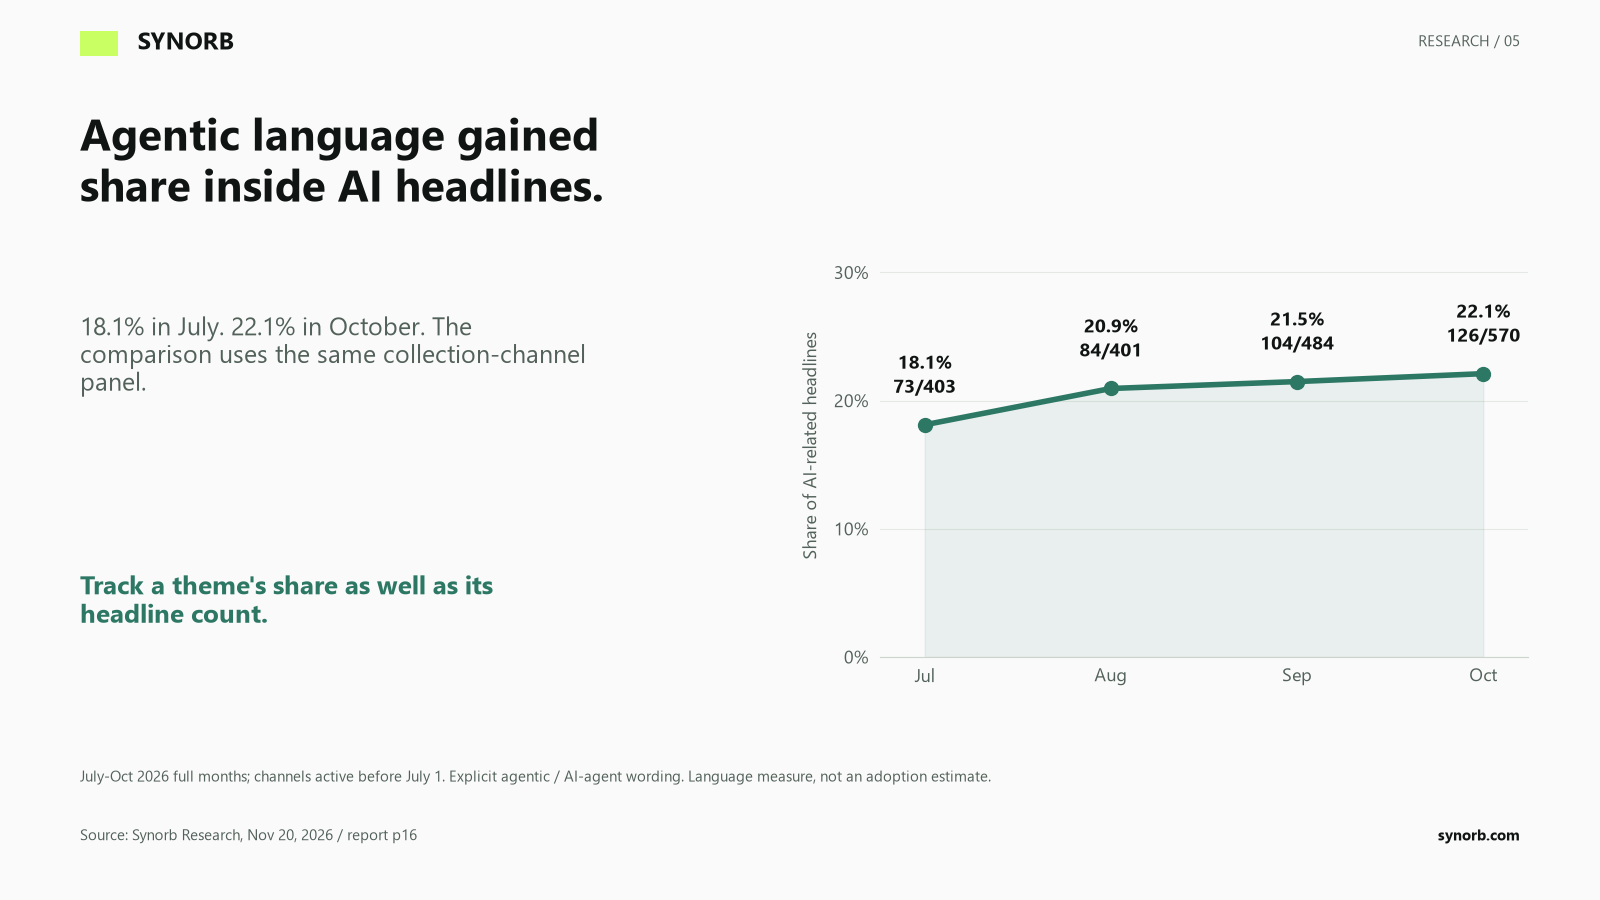
Agentic language gained share within AI headlines.
In a separate fixed collection-channel panel covering complete July-October months, agentic or explicit AI-agent wording increased from 18.1% to 22.1% of AI-related headlines. This measures a change in language. Establishing deployment scope, productivity or financial impact requires evidence from the underlying articles and further investigation.
Put The Map To Work
Start with the companies relevant to your holdings, coverage or research question. Browse their sectors and industries, then use Synorb to bring available company sources into your research workflow.
If you use Claude or ChatGPT, connect Synorb to bring company sources into your research workflow.
For example, ask your agent:
For the companies I follow, find recent posts describing a named AI workflow. Group them by sector. Include the publication date and original link, attribute each claimed result to its publisher, and flag questions the source leaves unanswered.
Or ask it to compare what a company is publishing with its peers, identify a change in the questions it addresses, or assemble sources for a briefing on your beat. Specify your companies and time window, and check the original material behind consequential claims.
No person can keep up with every company blog. Your agents can help you decide which sources deserve a closer read.
Explore the map and request the companion report →
About The Research
The blogging census and collected-post study have different denominators. The census identifies active bloggers in a defined company universe; the report analyzes eligible posts collected from observed publishers. Collection depth and publishing cadence vary by source. Headline language measures corporate communication. It does not establish AI adoption, spending, productivity, causation or stock performance. The monthly comparisons use a separate historical channel panel and do not establish complete historical collection. Company-reported outcomes remain attributed to their publishers. Information only; not investment advice.